Research supports weeks-to-months, not a universal deadline. Across the studies that directly reported or modelled formation time, central estimates ran from 59 to 154 days and individual estimates from 4 to 335 days. Those figures depend on the behaviour, the threshold and model used, and whether the estimate was extrapolated.
The headline numbers—with their context
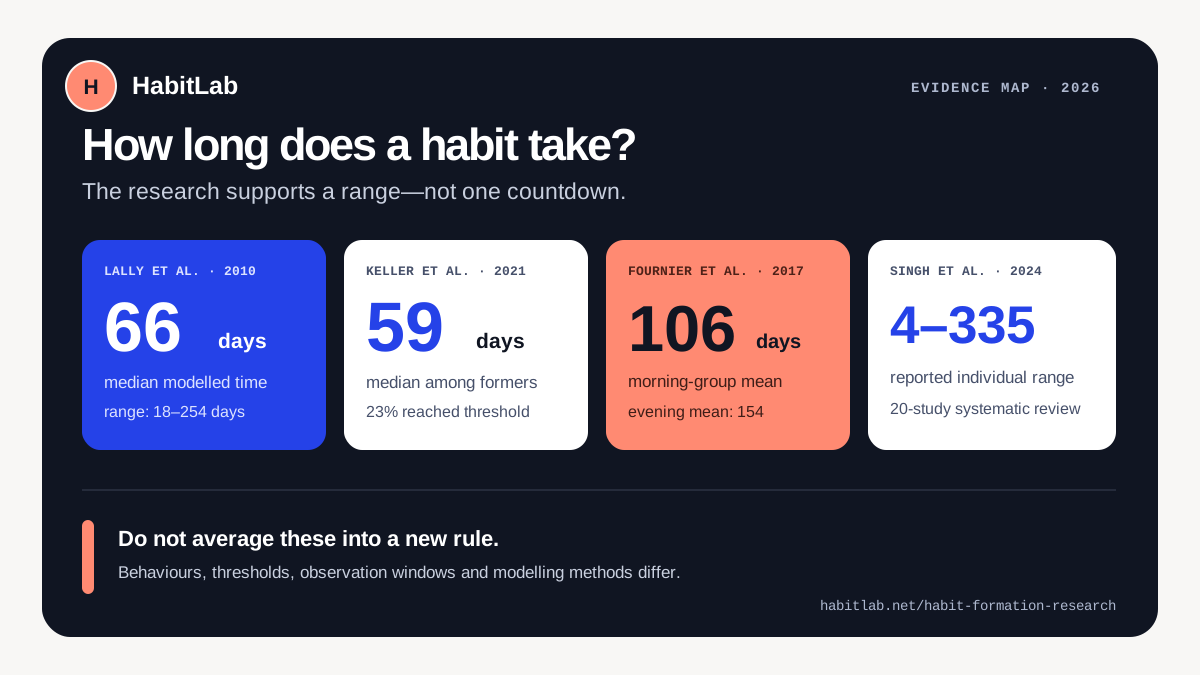
The evidence table
| Study | Design | What was measured | Headline result | Important limitation |
|---|---|---|---|---|
| Lally et al. (2010) | 96 volunteers chose a daily eating, drinking or activity behaviour; 12-week daily tracking. | Self-reported automaticity modelled toward 95% of each person’s plateau. | Median 66 days; modelled range 18–254 days. | The curve fit only a subset of participants, and some estimates extend beyond the 84-day observation window. |
| Keller et al. (2021) | 192 adults planned a daily nutrition behaviour using either a routine cue or a time cue; 84-day trial. | Daily plan enactment and automaticity, fitted with asymptotic curves. | Median 59 days among participants who successfully formed a habit; range reported in the review as 4–335 days. | Only 23% reached the study threshold. Long estimates were extrapolated beyond the observation period. |
| Fournier et al. (2017) | 48 students repeated a brief stretch on waking or before bed and reported for 90 days. | Daily self-reported automaticity plus modelled learning curves. | Modelled mean 106 days in the morning group and 154 days in the evening group. | A small sample, one simple stretch and extrapolation beyond the 90-day tracking period limit generalisation. |
| Singh et al. (2024) | Systematic review of 20 health-habit studies covering 2,601 participants. | Habit or automaticity questionnaires across diet, activity, flossing and other health behaviours. | Only four studies reported formation time directly: medians 59–66 days, means 106–154 days, individual range 4–335 days. | Eleven included studies had high risk-of-bias ratings; behaviours and measures varied substantially. |
Critical distinction: these are not four replications of the same test. Populations, behaviours, thresholds and curve-fitting methods differ, so the numbers should not be averaged into a new universal target.
How to read habit timeline claims
- Ask what became habitual. A 15-second stretch and an exercise routine are not equivalent.
- Ask how habit was measured. Most field studies use self-reported automaticity, not an objective switch from “not a habit” to “habit.”
- Separate observation from extrapolation. A model can estimate a plateau beyond the period researchers actually watched.
- Check who reached the threshold. A median among successful participants is not the success rate for everyone enrolled.
- Use a range, not a countdown. The practical job is to make the cue stable and repetition recoverable.
How HabitLab built this table
We started with the 2024 systematic review’s four studies that directly reported time to formation, then checked the original Lally, Keller and Fournier records for their design, measure and interpretation. We kept mean and median estimates separate, labelled modelled results, and added limitations that materially change how a reader should use the number.
This is an editorial evidence map, not a new meta-analysis. Send corrections or missing timeline studies to hello@habitlab.net.